Sample reports from production deployments.
Live platforms built by D2Infinite, deployed and used in production by real teams. Switch tabs to explore each system.
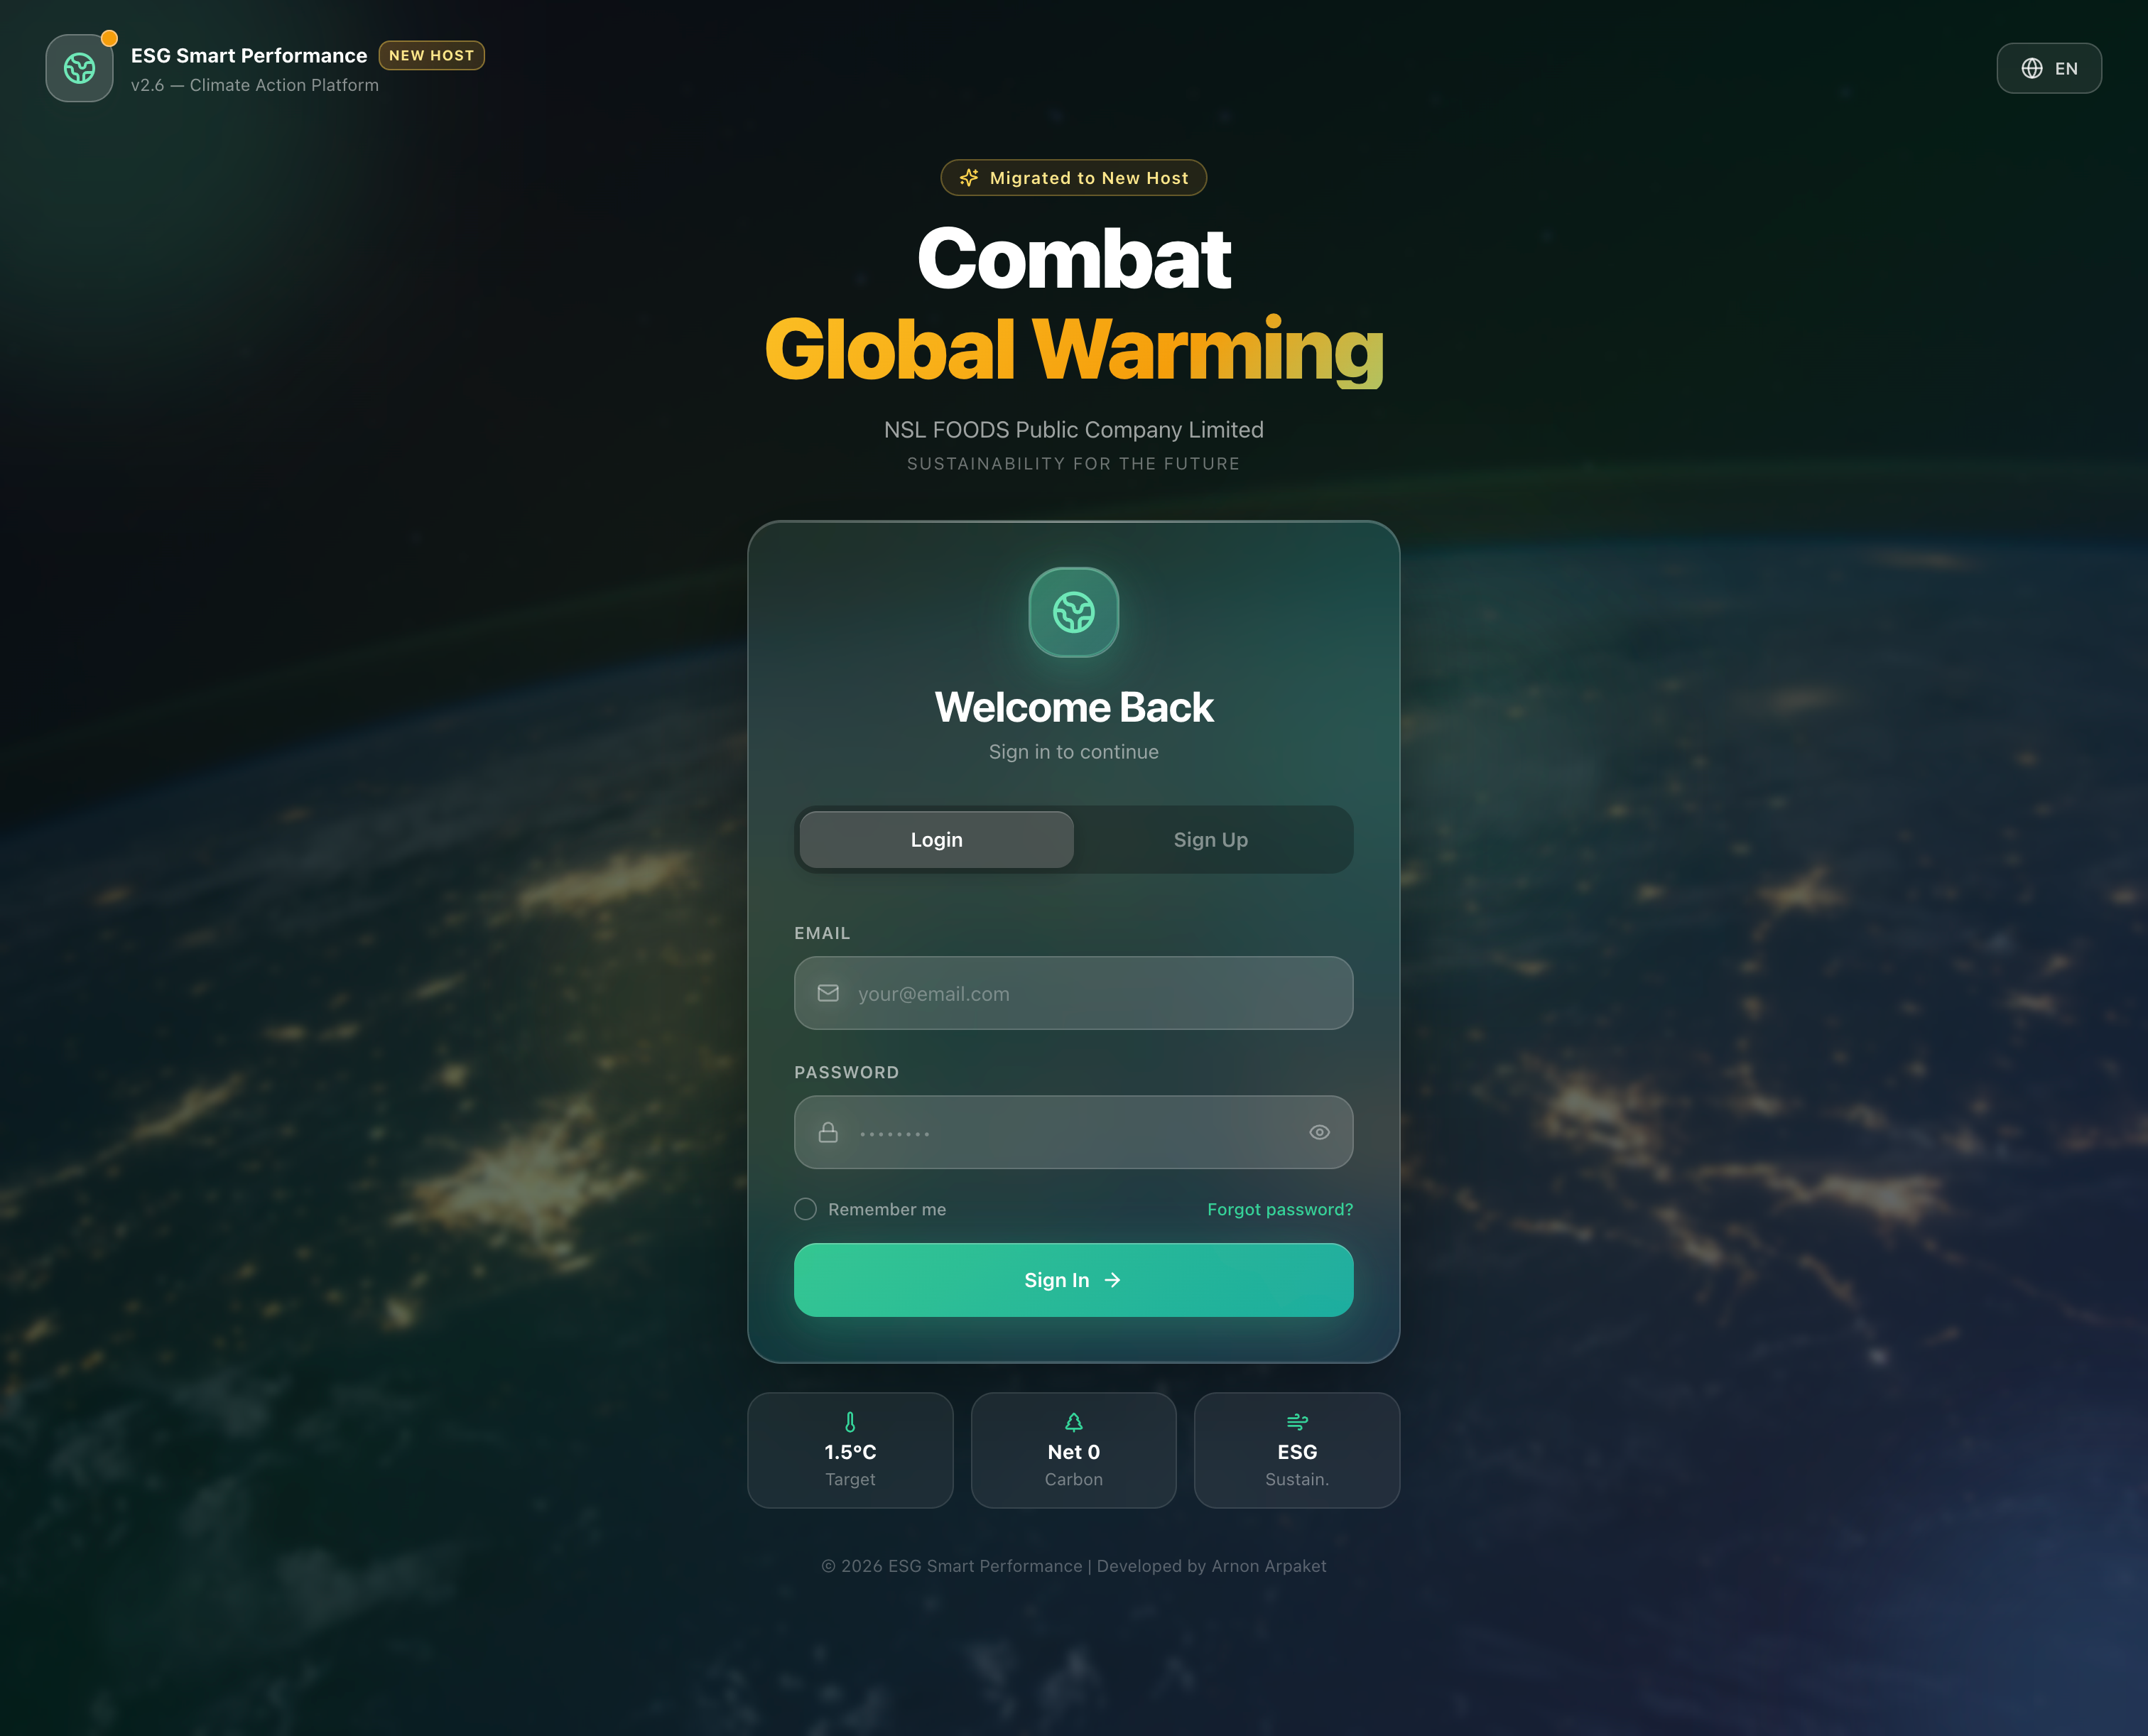
Sustainability intelligence for an enterprise food manufacturer.
The Brief
Centralize fragmented ESG data — Energy, GHG, Water, Waste, Social, and Governance — across multiple branches and production facilities into a single source of truth.
Replace spreadsheets and PDF compilations with a governed platform that supports role-based access, auditability, and on-demand exports for executive review and external reporting.
What's Inside
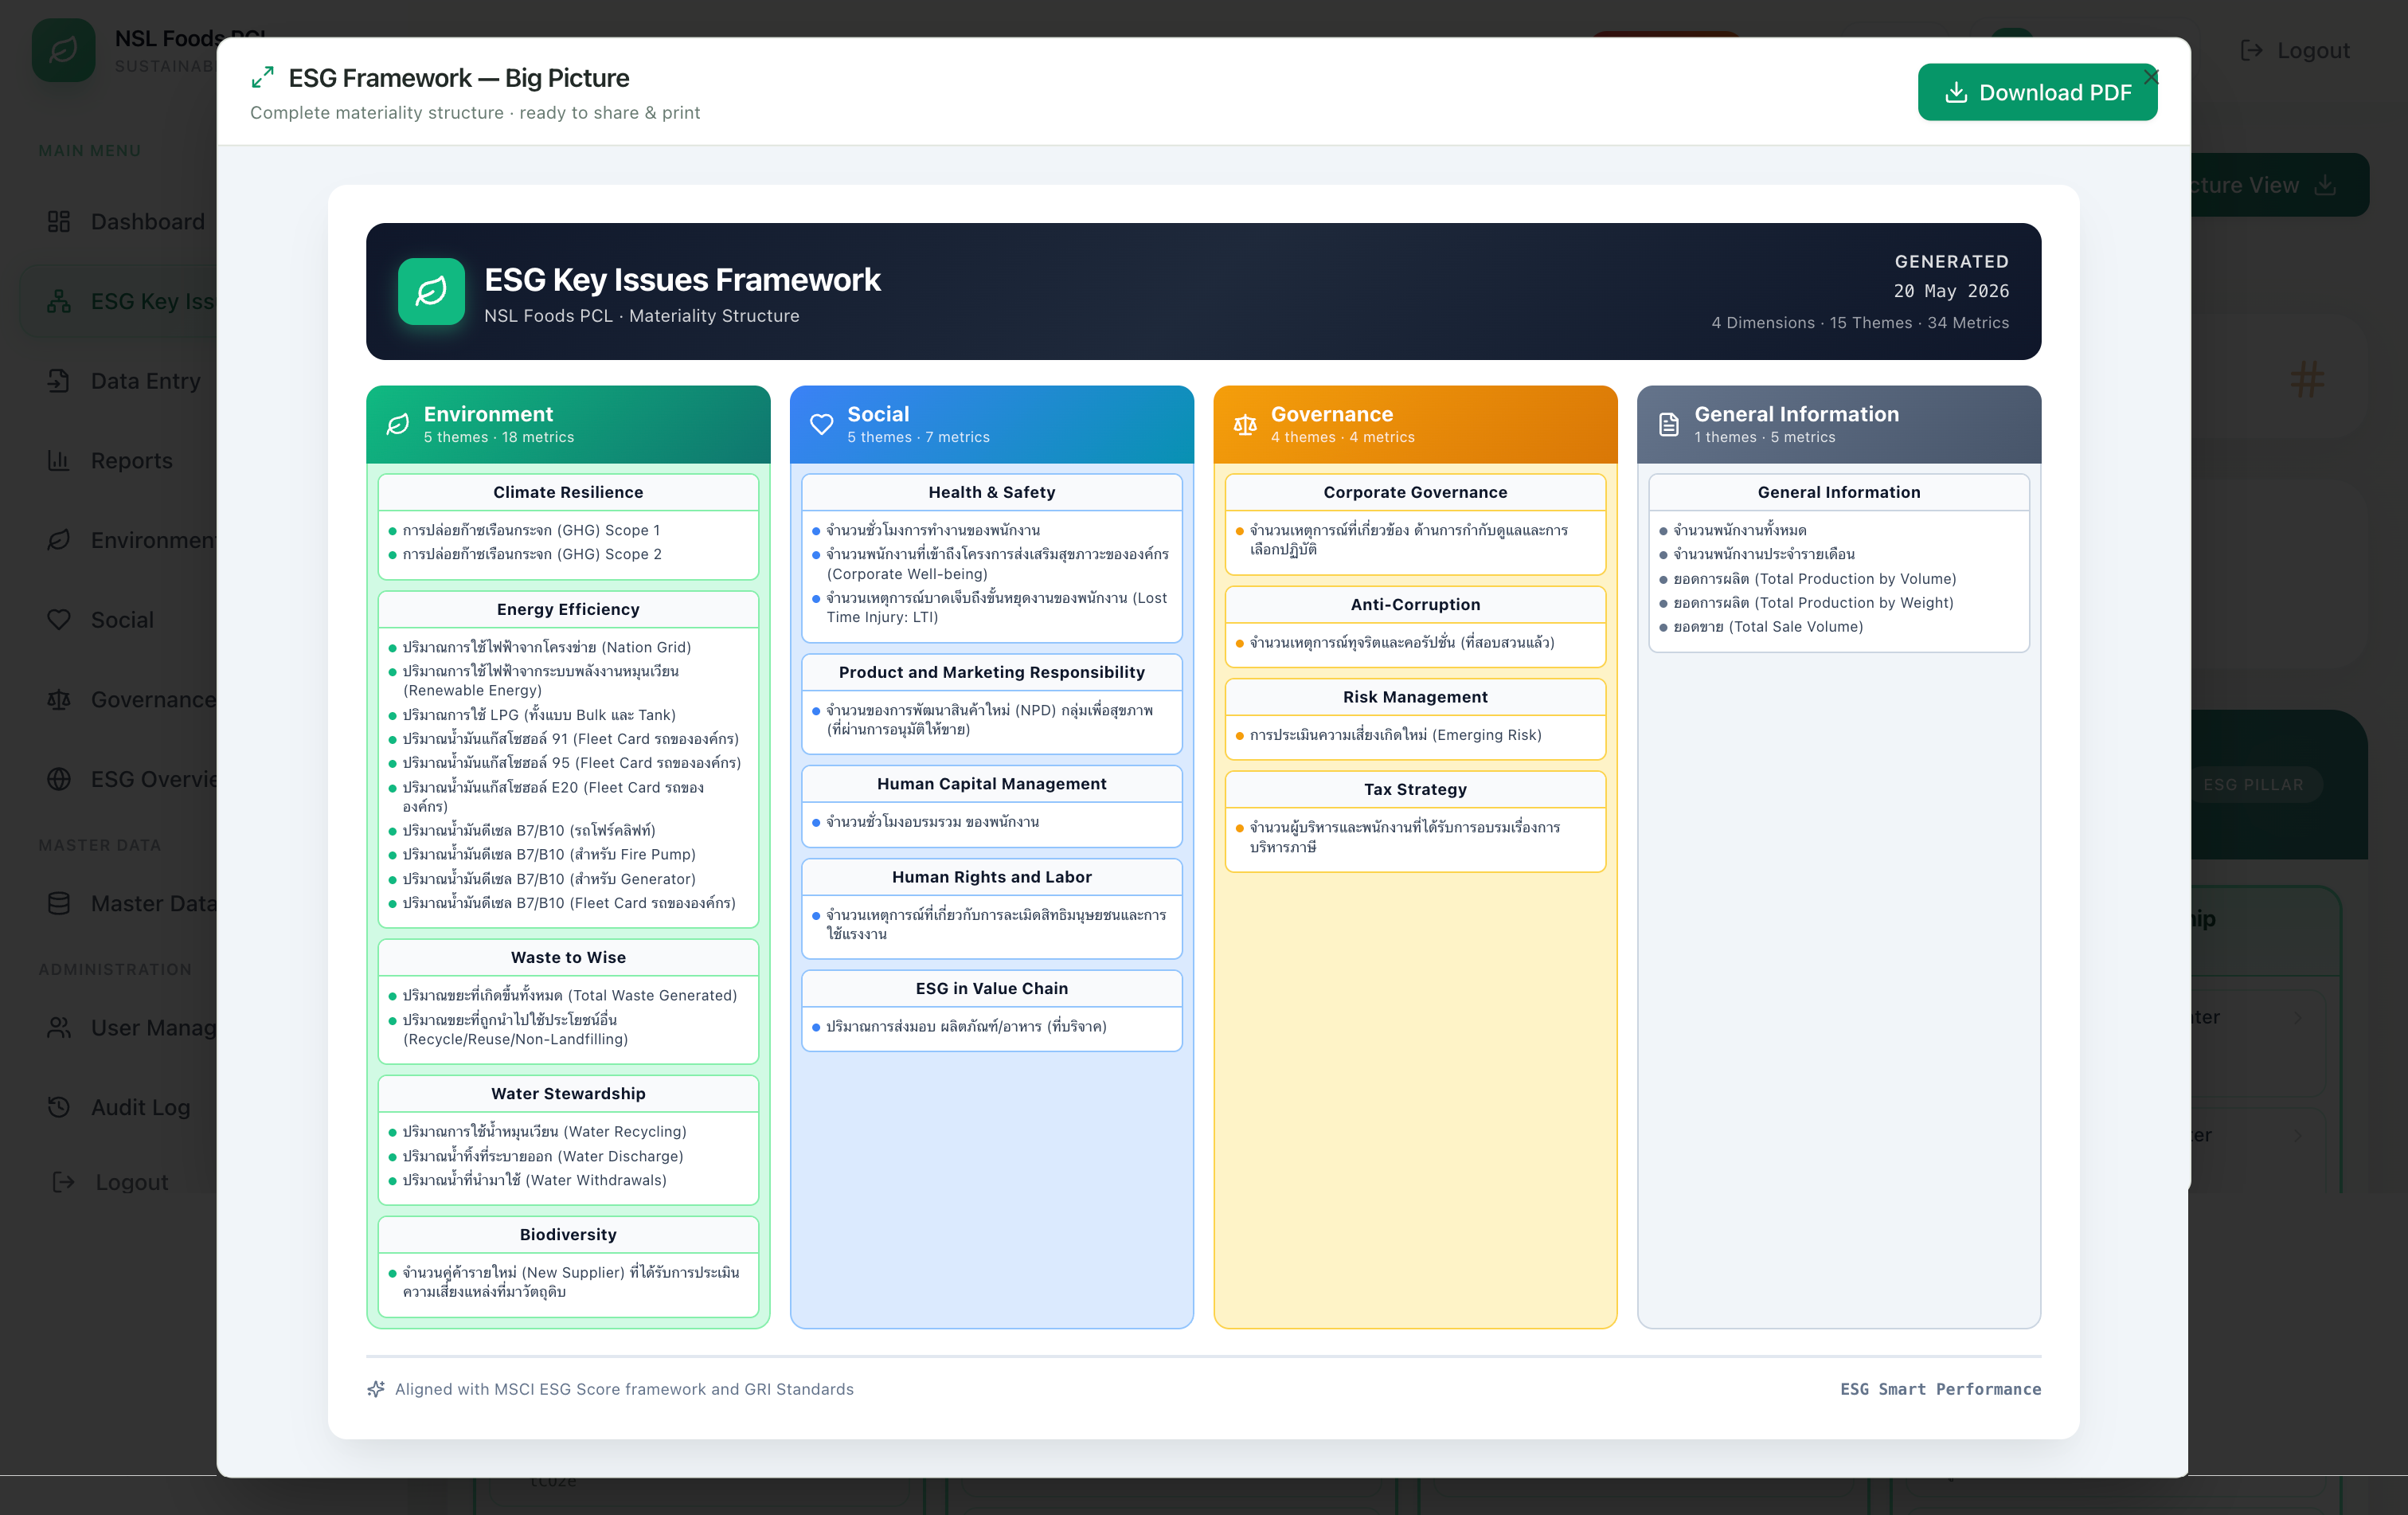
Big Picture Summary
The whole ESG framework on one page — dimensions, themes, metrics, and progress bars an executive can read in a minute. Export to print-ready PDF in one click.
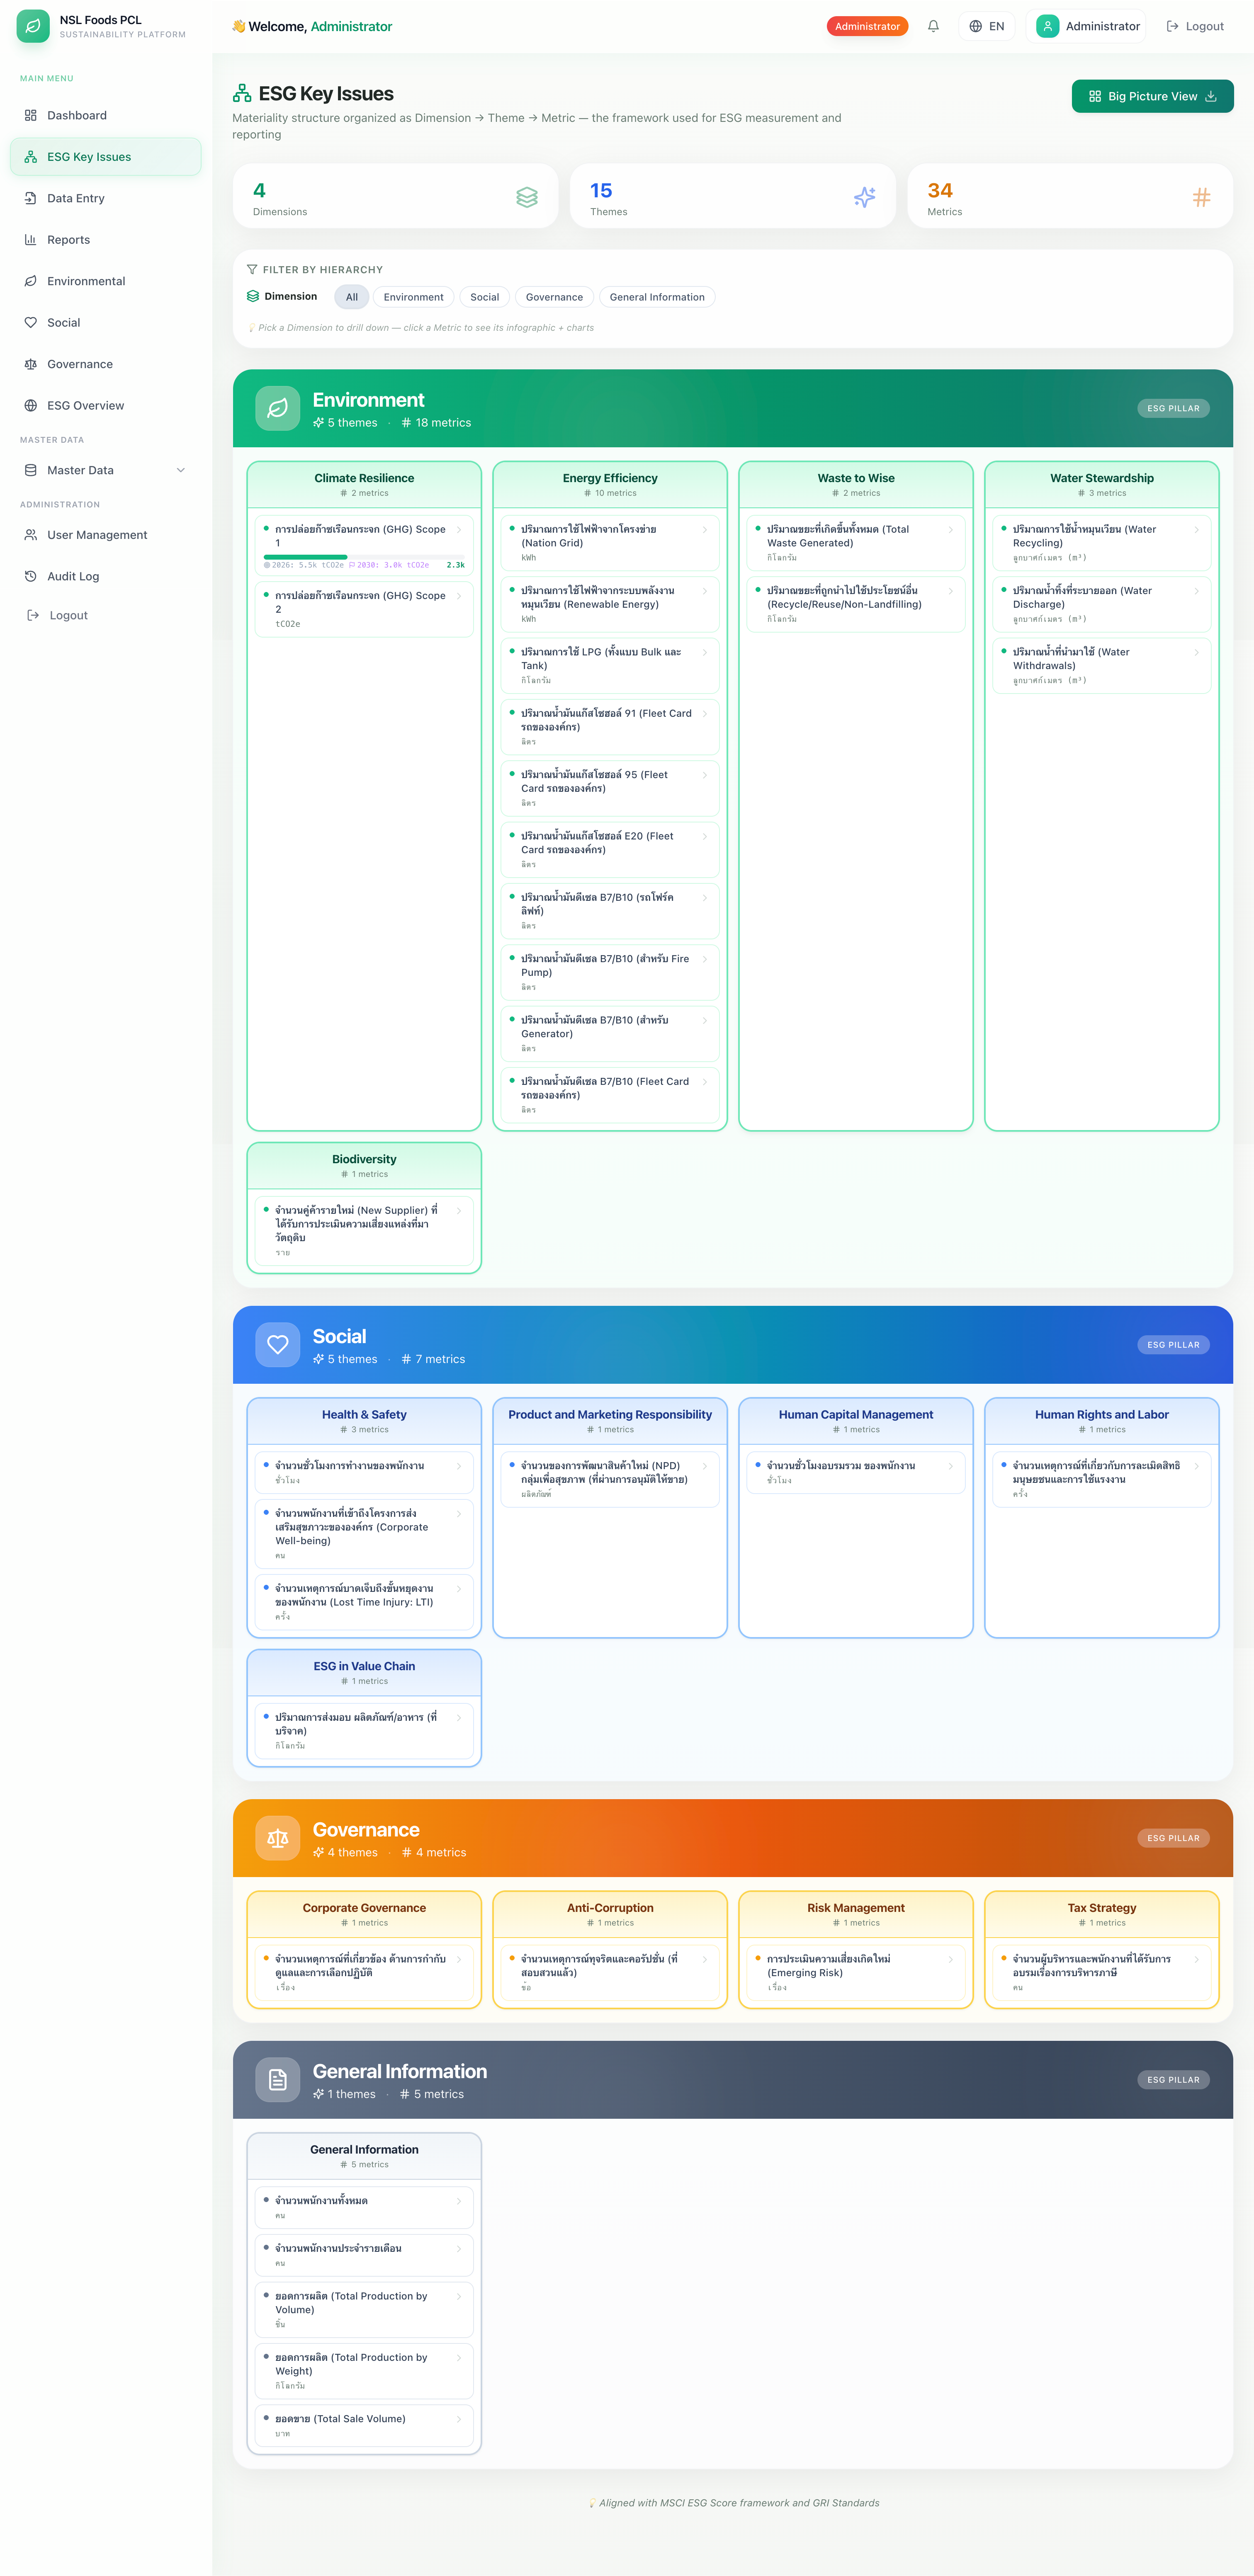
Materiality Framework
Dimension → Theme → Metric structure across six ESG domains. Drill from pillar to a single metric and see its infographic and trends, aligned with MSCI ESG & GRI.
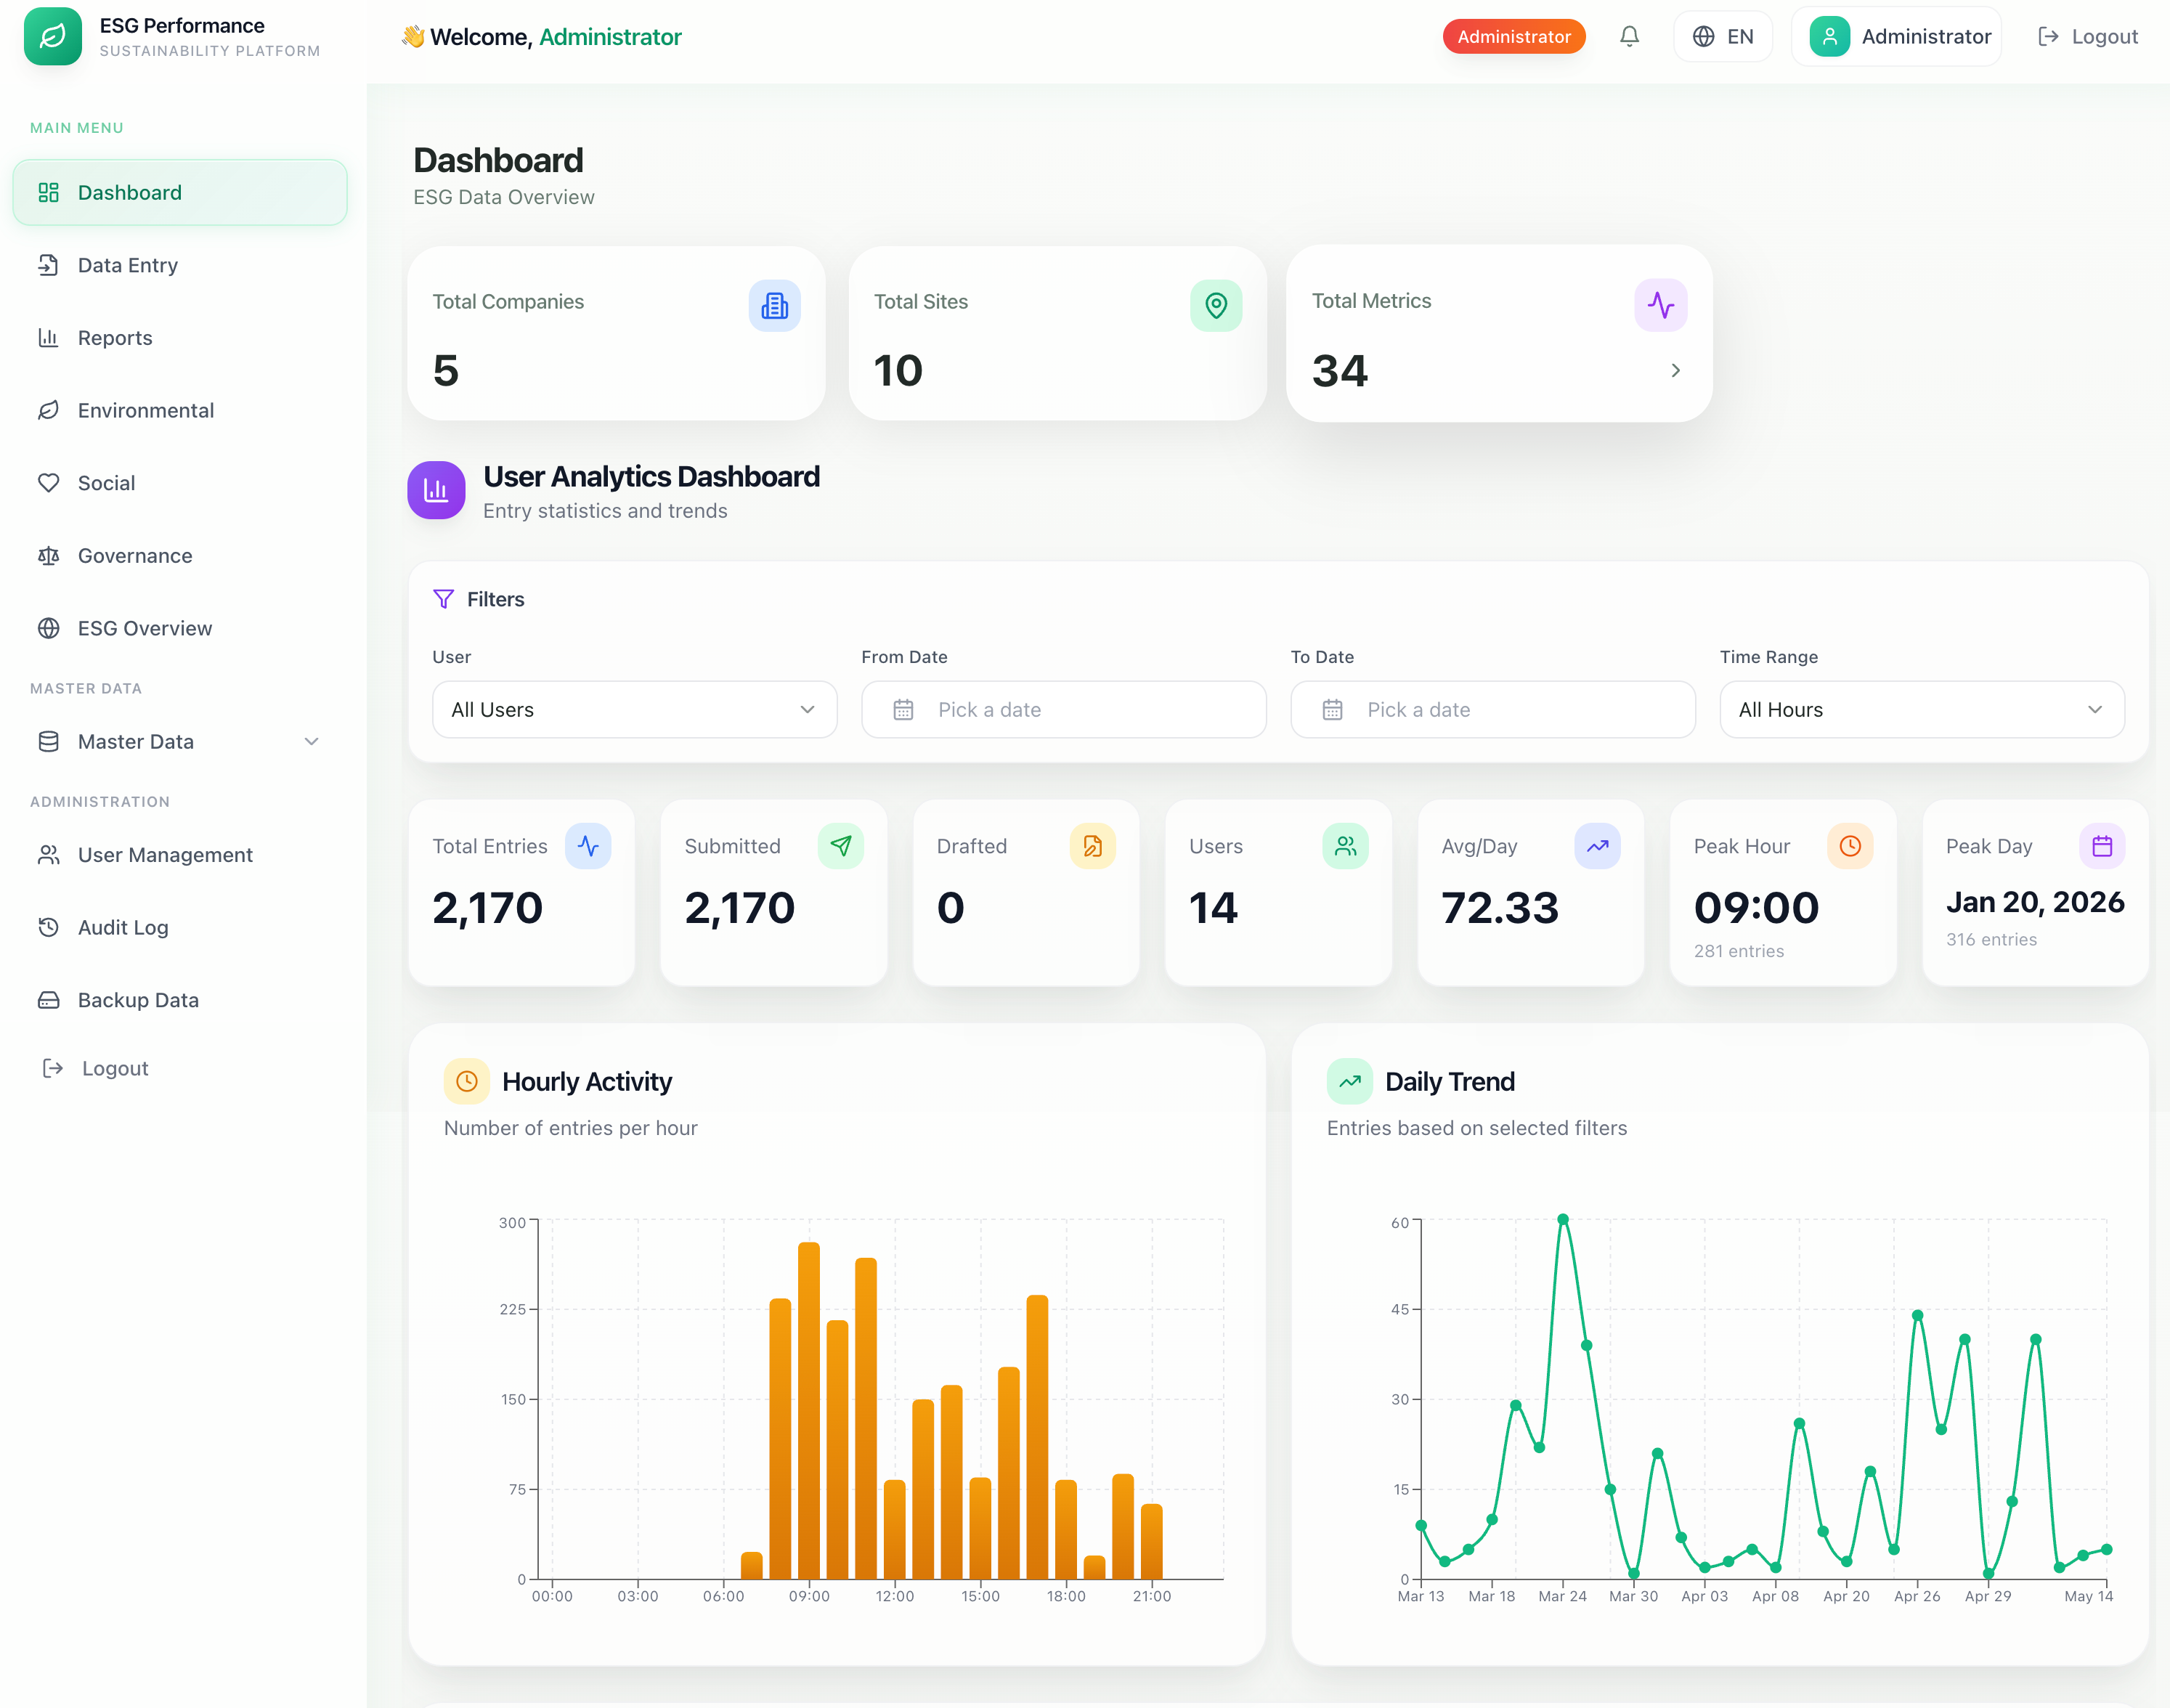
Role-Based Access
Admin, Executive, Supervisor, and Staff tiers with row-level permissions and a full audit trail.
Export to Excel & PDF
One-click executive exports — TV View for screens, Excel for offline review, one-page PDF for the board.
Screens shown are from live deployments. Personal data has been redacted. Full system walkthrough available on request under NDA.
Request a DemoReady to make faster, sharper decisions?
30 minutes with our team and you'll know exactly how the platform fits your organization. No deck. No slides. Real product, real data.